Visualizing housing price trends with QGIS, part 0 - Introduction
This is an introduction to a series of posts to document the results of some self-study sessions carried out during the Covid-19 pandemic period, with its times of isolation and short-term layoffs. Geospatial analysis is very useful for many industries and this was a great opportunity to deepen my knowledge in the field. I have focused on QGIS, which is a massive open-sourced piece of GIS software (Geographic Information System), providing a stack of tools from backend data access to visualization and map generation.
I’ve always been a fan of learning by doing and, having access to a PostGIS database with housing sales prices in Sweden (enabling this access might become the topic for another post in the future), I was considering how to utilize this for the purpose of learning new tools and methodology.
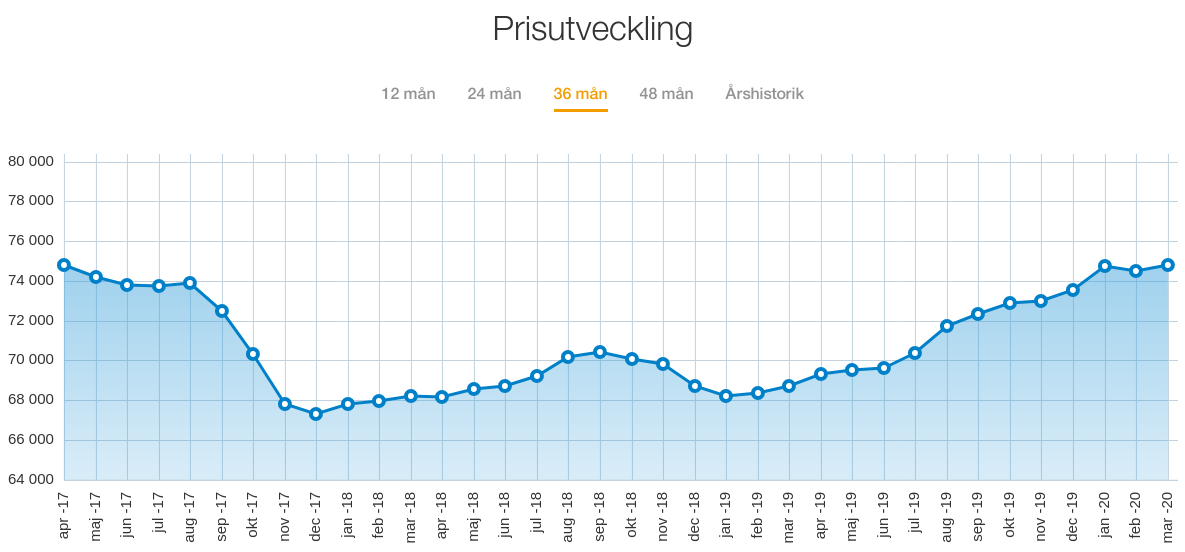
Housing price trends are freely available on the Internet, e.g. at Mäklarstatistik, and they are presented in the obvious way: aggregated time series split by property type, city and district.
This is of course very useful and accessible, but I was thinking about a way to present the price trends on a map, covering many cities and/or district at the same time. So, the end goal of this little project became apparent:
How do we go about to visualize housing price trends in a way reminiscent of weather forecasts, where contour plots of the air pressure and heat map coloring are animated to show the movement of weather systems and changes of temperature?

So, perhaps jumping the gun a bit, here is an example of the result (still a work in progress). The contours and colors represent the price per area of apartments in Stockholm. Each image in the video visualizes three months of sales prices (as shown in the upper right corner) and the images are updated once every month. The “equidistance” of the contour lines is 5,000 SEK/m².
There are a few steps involved to go from the apartment sales data points to the above animation and this, and other things, will be the topic for future posts in this series.
